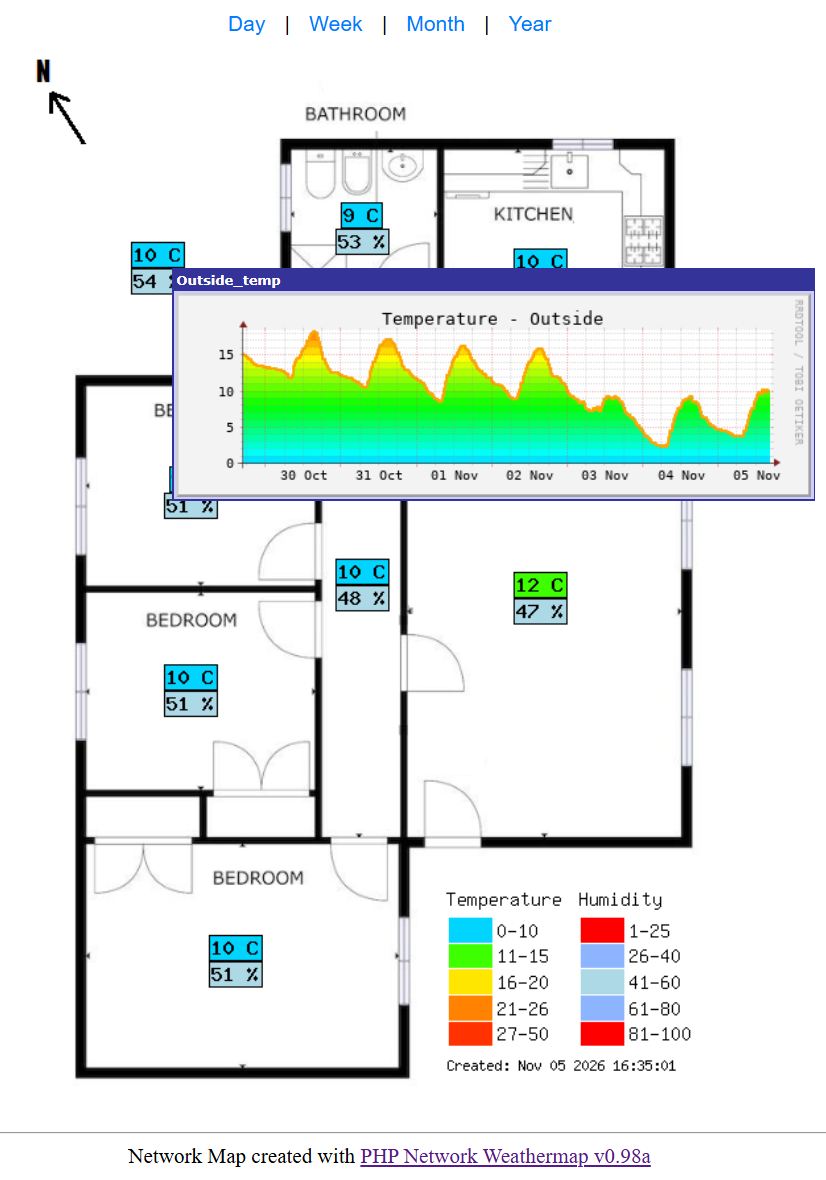
As foreshadowed in my post about automation at the refugio: “the most likely thing is every room in the house will end up with one” happened. I ended up getting a temperature and humidity sensor for every room and then setting up a tool I used in the early 2000’s for network monitoring called PHP Network Weathermap to paint pretty pictures of the temperatures and humidity in every room. The tool allows you to quick see trends as you can see in the image above that fall has finally arrived in Cercedilla with the outdoor temperature dropping from highs in the 20s to 10’s and lows from the 10’s to 5’s. You can consult it in realtime here.
Read on to see how container technology allowed me to realize this dream and how AI can even help with things that are way older than it!
Origin Story
I originally did use Network Weathermap to monitor a network:
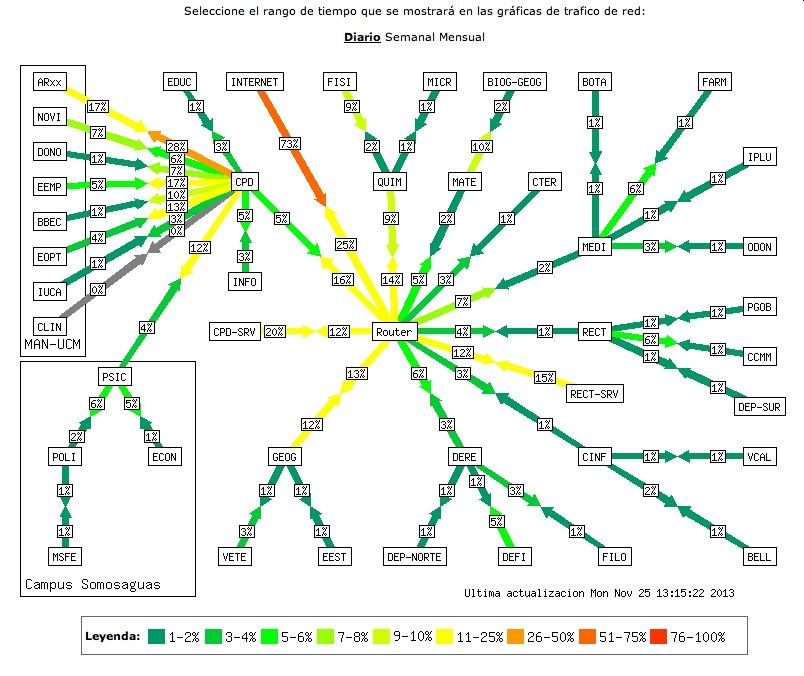
What you see above are the network uplinks between the faculty buildings at a large university and the current inbound and outbound utilization of each of the links. This graphic was on a big 3x3 video wall and updated every 5 minutes with multiple people monitoring it and the other graphics that we had on it. This allowed us to know right away when things were getting saturated, especially our 1gb internet uplink provided by RedIRIS which might not sound like a big pipe today, but back in 2013 was huge. An example of when the internet link turned red (76-100% utilization) was when Prince William and Catherine got married on Friday April 29th 2011 and all the professors tunned into streaming sites to watch the wedding. It is unfortunate that after all the work we did to enable and ensure multicast worked on the network they did not use it to watch it the wedding which would have meant downloading the video only one time and not collapsing the internet uplink, but the problem with multicast is that it never really took off. But I digress. Back to the origin story: in addition to making network weather maps we also used it to make maps of the data center temperatures, UPS loads, and generator status:
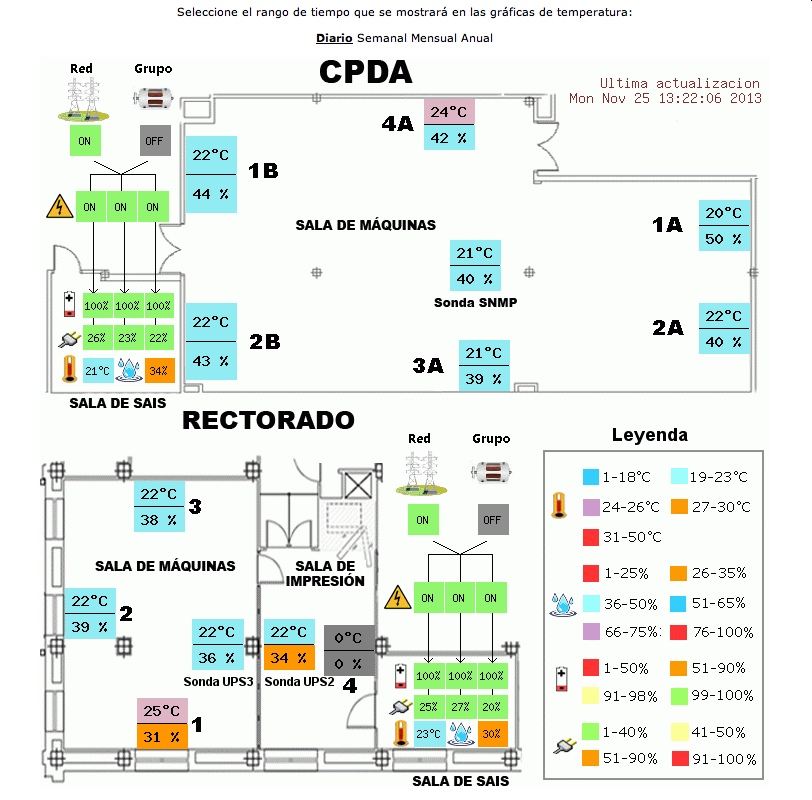
So when I tested my first Tapo T315 Smart Temperature & Humidity Monitor I was already thinking about setting up a Refugio Network Weather Map.
Implementation
This was a multiple phased implementation involving the following steps:
- Figuring how to get the data off the sensors
- Saving the data
- Generating pretty graphs from the data
- Generating pretty the weathermap
I will go into each step in nitty gritty detail so be forewarned. If you prefer you can just skip to the final product: Refugio Network Weathermap.
1. Figuring how to get the data off the sensors
Before actually doing anything with Network Weathermap I needed to figure out how to get the data off the sensors which fortunately others had already done the heavy lifting and created python-kasa which is a Python library that allows control of TPLink’s smart devices.
It is installed easily enough with:
pip install python-kasa
and then pointed it to the Tapo SmartHub where the Tapo T315 sensors are uplinked to:
andrew@Taygete:~$ kasa --username xxxxxxx --password xxxxxxx --host 192.168.1.59 feature
Discovering device 192.168.1.59 for 10 seconds
== Primary features ==
State (state): False
Current consumption (current\_consumption): 0.0 W

== Information ==
Signal Level (signal\_level): 2
Auto off at (auto\_off\_at): None
Cloud connection (cloud\_connection): True
Today's consumption (consumption\_today): 0.0 kWh
This month's consumption (consumption\_this\_month): 10.452 kWh
Update available (update\_available): None
Check latest firmware (check\_latest\_firmware): <Action>

== Configuration ==
Auto off enabled (auto\_off\_enabled): False
Auto off in (auto\_off\_minutes): 120 min (range: 0-65536)
Auto update enabled (auto\_update\_enabled): True
LED (led): True

== Debug ==
Device ID (device\_id): 8022770D4E66C5377441F5EB11CC6AED22BB6221
RSSI (rssi): -56 dBm
SSID (ssid): JupiterRefugio\_2.4ghz
On since (on\_since): None
Reboot (reboot): <Action>
Current firmware version (current\_firmware\_version): 1.3.1 Build 240621 Rel.162048
Available firmware version (available\_firmware\_version): None
Device time (device\_time): 2024-11-02 14:11:50+01:00
andrew@Taygete:~$
andrew@Taygete:~$
andrew@Taygete:~$ kasa --username ahines7@hotmail.com --password 20Tapo24motica! --host 192.168.1.60 feature
Discovering device 192.168.1.60 for 10 seconds
== Primary features ==

== Information ==
Signal Level (signal\_level): 3
Overheated (overheated): False
Alarm (alarm): False
Alarm source (alarm\_source): None
Cloud connection (cloud\_connection): True
Update available (update\_available): None
Check latest firmware (check\_latest\_firmware): <Action>

== Configuration ==
Alarm sound (alarm\_sound): \*Doorbell Ring 1\* Doorbell Ring 2 Doorbell Ring 3 Doorbell Ring 4 Doorbell Ring 5 Doorbell Ring 6 Doorbell Ring 7 Doorbell Ring 8 Doorbell Ring 9 Doorbell Ring 10 Phone Ring Alarm 1 Alarm 2 Alarm 3 Alarm 4 Dripping Tap Alarm 5 Connection 1 Connection 2
Alarm volume (alarm\_volume): low normal \*high\*
Test alarm (test\_alarm): <Action>
Stop alarm (stop\_alarm): <Action>
Auto update enabled (auto\_update\_enabled): False
LED (led): True

== Debug ==
Device ID (device\_id): 802DBBC98CFE9012CA8631A7B52C341D22F9A8A0
RSSI (rssi): -38 dBm
SSID (ssid): JupiterRefugio\_2.4ghz
Reboot (reboot): <Action>
Current firmware version (current\_firmware\_version): 1.5.20 Build 240911 Rel.110830
Available firmware version (available\_firmware\_version): None
Device time (device\_time): 2024-11-02 14:17:30+01:00

== Child Kitchen ==

== Primary features ==
Humidity (humidity): 72 %
Temperature (temperature): 19.1 celsius

== Information ==
Signal Level (signal\_level): 3
Battery level (battery\_level): 100 %
Cloud connection (cloud\_connection): True
Update available (update\_available): None
Check latest firmware (check\_latest\_firmware): <Action>

== Configuration ==
Temperature unit (temperature\_unit): \*celsius\* fahrenheit

== Debug ==
Device ID (device\_id): 802E095A58B1219B831A9487076587E022774E3C
RSSI (rssi): -55 dBm
Reboot (reboot): <Action>
Battery low (battery\_low): False
Current firmware version (current\_firmware\_version): 1.8.0 Build 230921 Rel.091446
Available firmware version (available\_firmware\_version): None
Humidity warning (humidity\_warning): True
Report interval (report\_interval): 16 s
Temperature warning (temperature\_warning): True

== Child Living Room ==

== Primary features ==
Humidity (humidity): 58 %
Temperature (temperature): 21.1 celsius

== Information ==
Signal Level (signal\_level): 3
Battery level (battery\_level): 100 %
Cloud connection (cloud\_connection): True
Update available (update\_available): None
Check latest firmware (check\_latest\_firmware): <Action>

== Configuration ==
Temperature unit (temperature\_unit): \*celsius\* fahrenheit

== Debug ==
Device ID (device\_id): 802ECCF9E3B40CEE3E7188148FACD49F2277A6B4
RSSI (rssi): -39 dBm
Reboot (reboot): <Action>
Battery low (battery\_low): False
Current firmware version (current\_firmware\_version): 1.8.0 Build 230921 Rel.091446
Available firmware version (available\_firmware\_version): None
Humidity warning (humidity\_warning): False
Report interval (report\_interval): 16 s
Temperature warning (temperature\_warning): False
andrew@Taygete:~$
Whole lot of info and just what i need is given for each of the sensors:
Humidity (humidity): 58 %
Temperature (temperature): 21.1 celsius
So we are in business! Step 1 done!
2. Saving the data
So back in the last century an intern at CERN, Tobia Oetiker, created the Multi Router Traffic Grapher (MRTG) to monitor and measures network traffic load on routers (and later anything) and generate pretty pictures of that data:
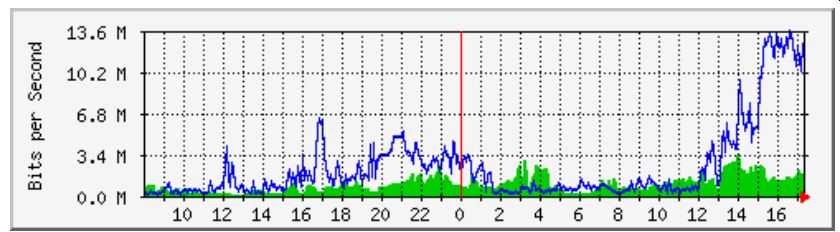
I discovered this while wrangling Cisco routers out in San Francisco and boy did I love it and the amazing visibility that it gives you because it automatically would create graphics for the current day, last week, last month, and if I remember correctly, last year. This allowed you to instantly use human pattern recognition to see if something abnormal was happening or not.
After MRTG Tobias went on to create a more versatile tool, RRDtool, that is a “high performance data logging and graphing system for time series data” and just is incredible. The base is a “round robin database” (rrd) that is a data storage system designed to hold time-series data—such as network traffic, temperatures, and CPU load using a fixed-size, circular buffer in such a way that after creation it never grows any larger. On top of that RRDtool allows generating graphics but that will be covered in step 3. Generating pretty graphs from the data.
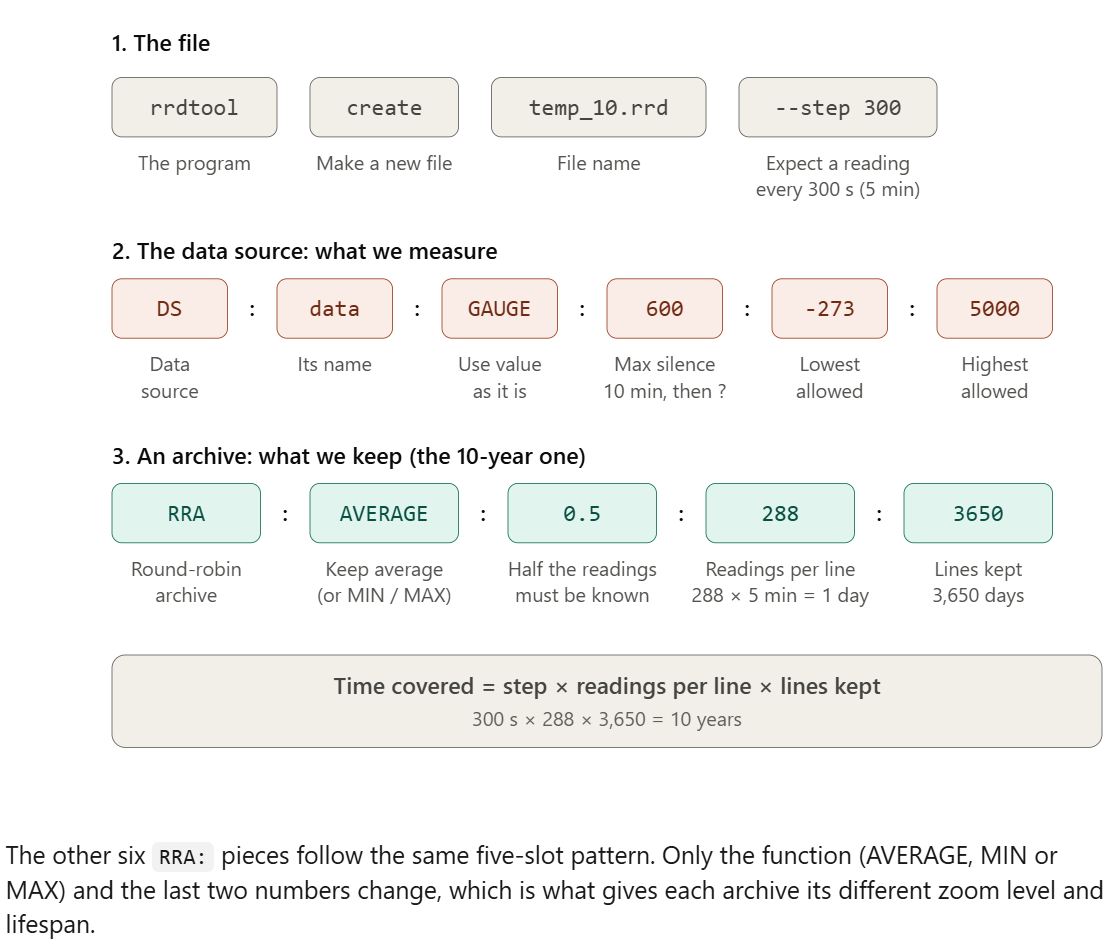
The data is stored in rrd’s that are created with a cyptic command like this:
rrdtool create temp_10.rrd --step 300 DS:data:GAUGE:600:-273:5000 RRA:AVERAGE:0.5:1:1200 RRA:MIN:0.5:288:3650 RRA:MAX:0.5:288:3650 RRA:AVERAGE:0.5:288:3650 RRA:AVERAGE:0.5:6:700 RRA:AVERAGE:0.5:24:775 RRA:AVERAGE:0.5:288:797
And here is a Claude explanation of what is going on:
I wanted to store multiple years of data but was unsure of how much space would be needed so I did some testing and created multiple test rrds:
- 10 year temperature
- 50 year temperature
- 10 year temperature & humidity
- 50 year temperature & humidity
and then a drum roll to see the file sizes of that were created (and would never get bigger):
pi@pirefugio:~ $ ls -lah tem*
-rw-r--r-- 1 pi pi 115K Mar 22 08:47 temp_10.rrd
-rw-r--r-- 1 pi pi 457K Mar 22 08:52 temp_50.rrd
-rw-r--r-- 1 pi pi 228K Mar 22 08:55 temp_humity_10.rrd
-rw-r--r-- 1 pi pi 913K Mar 22 08:56 temp_humity_50.rrd
almost 1mb per db for both temperature and humidity data per sensor is totally acceptable seeing this is not like when monitoring a lots of switches with 48 ports each and the max sensors I am looking at are 8. So that I settled on this 50 year definition for each of the sensors:
rrdtool create name_of_sensor.rrd --step 300 DS:temp:GAUGE:600:-273:5000 DS:humidity:GAUGE:600:0:100 RRA:AVERAGE:0.5:1:1200 RRA:MIN:0.5:288:18250 RRA:MAX:0.5:288:18250 RRA:AVERAGE:0.5:288:18250 RRA:AVERAGE:0.5:6:700 RRA:AVERAGE:0.5:24:775 RRA:AVERAGE:0.5:288:797
Now that I had the databases to insert the data I needed a script that would poll the sensors every 5 minutes and insert the data into them.
After a weekend coffee in bed session with AI here is the python script that is doing just that:
$ cat read_data.py
import subprocess
import json
import rrdtool

# Device mapping
devices = {
"802ECCF9E3B40CEE3E7188148FACD49F2277A6B4": "LivingRoom",
"802E095A58B1219B831A9487076587E022774E3C": "Kitchen",
"802EF50AE85E5FBA002CB8293104DA4022A6EE02": "MasterBedroom",
"802EEE0B2BFDC1AD7F8F45A33EF6E94322A66203": "Outside"
}

# Run Kasa command
try:
result = subprocess.run(
["kasa", "--username", "xxxxxxx", "--password", "xxxxxxx", "--host", "192.168.1.60", "--json"],
capture_output=True,
text=True,
check=True
)
data = json.loads(result.stdout)
except subprocess.CalledProcessError as e:
print("Error running Kasa command:", e)
exit(1)
except json.JSONDecodeError:
print("Error parsing JSON output")
exit(1)

# Extract temperature and humidity from child devices
child_devices = data.get("get_child_device_list", {}).get("child_device_list", [])

for device in child_devices:
device_id = device.get("device_id", "Unknown")
temp = device.get("current_temp", "N/A")
humidity = device.get("current_humidity", "N/A")

# Lookup the name from the dictionary
device_name = devices.get(device_id, "Unknown Device")

print(f"Device Name: {device_name}, Device ID: {device_id}, Temperature: {temp}°C, Humidity: {humidity}%")

# Let's update the rrdbs
if temp is not None and humidity is not None:
rrd_file = f"/sd/pv/rrdbs/{device_name}.rrd"
try:
rrdtool.update(rrd_file, f"N:{temp}:{humidity}")
print(f"Updated {rrd_file}: Temp={temp}, Humidity={humidity}")
except rrdtool.OperationalError as e:
print(f"Error updating {rrd_file}: {e}")

pi@pirefugio:/sd/pv/rrdbs $
3. Generating pretty graphs from the data
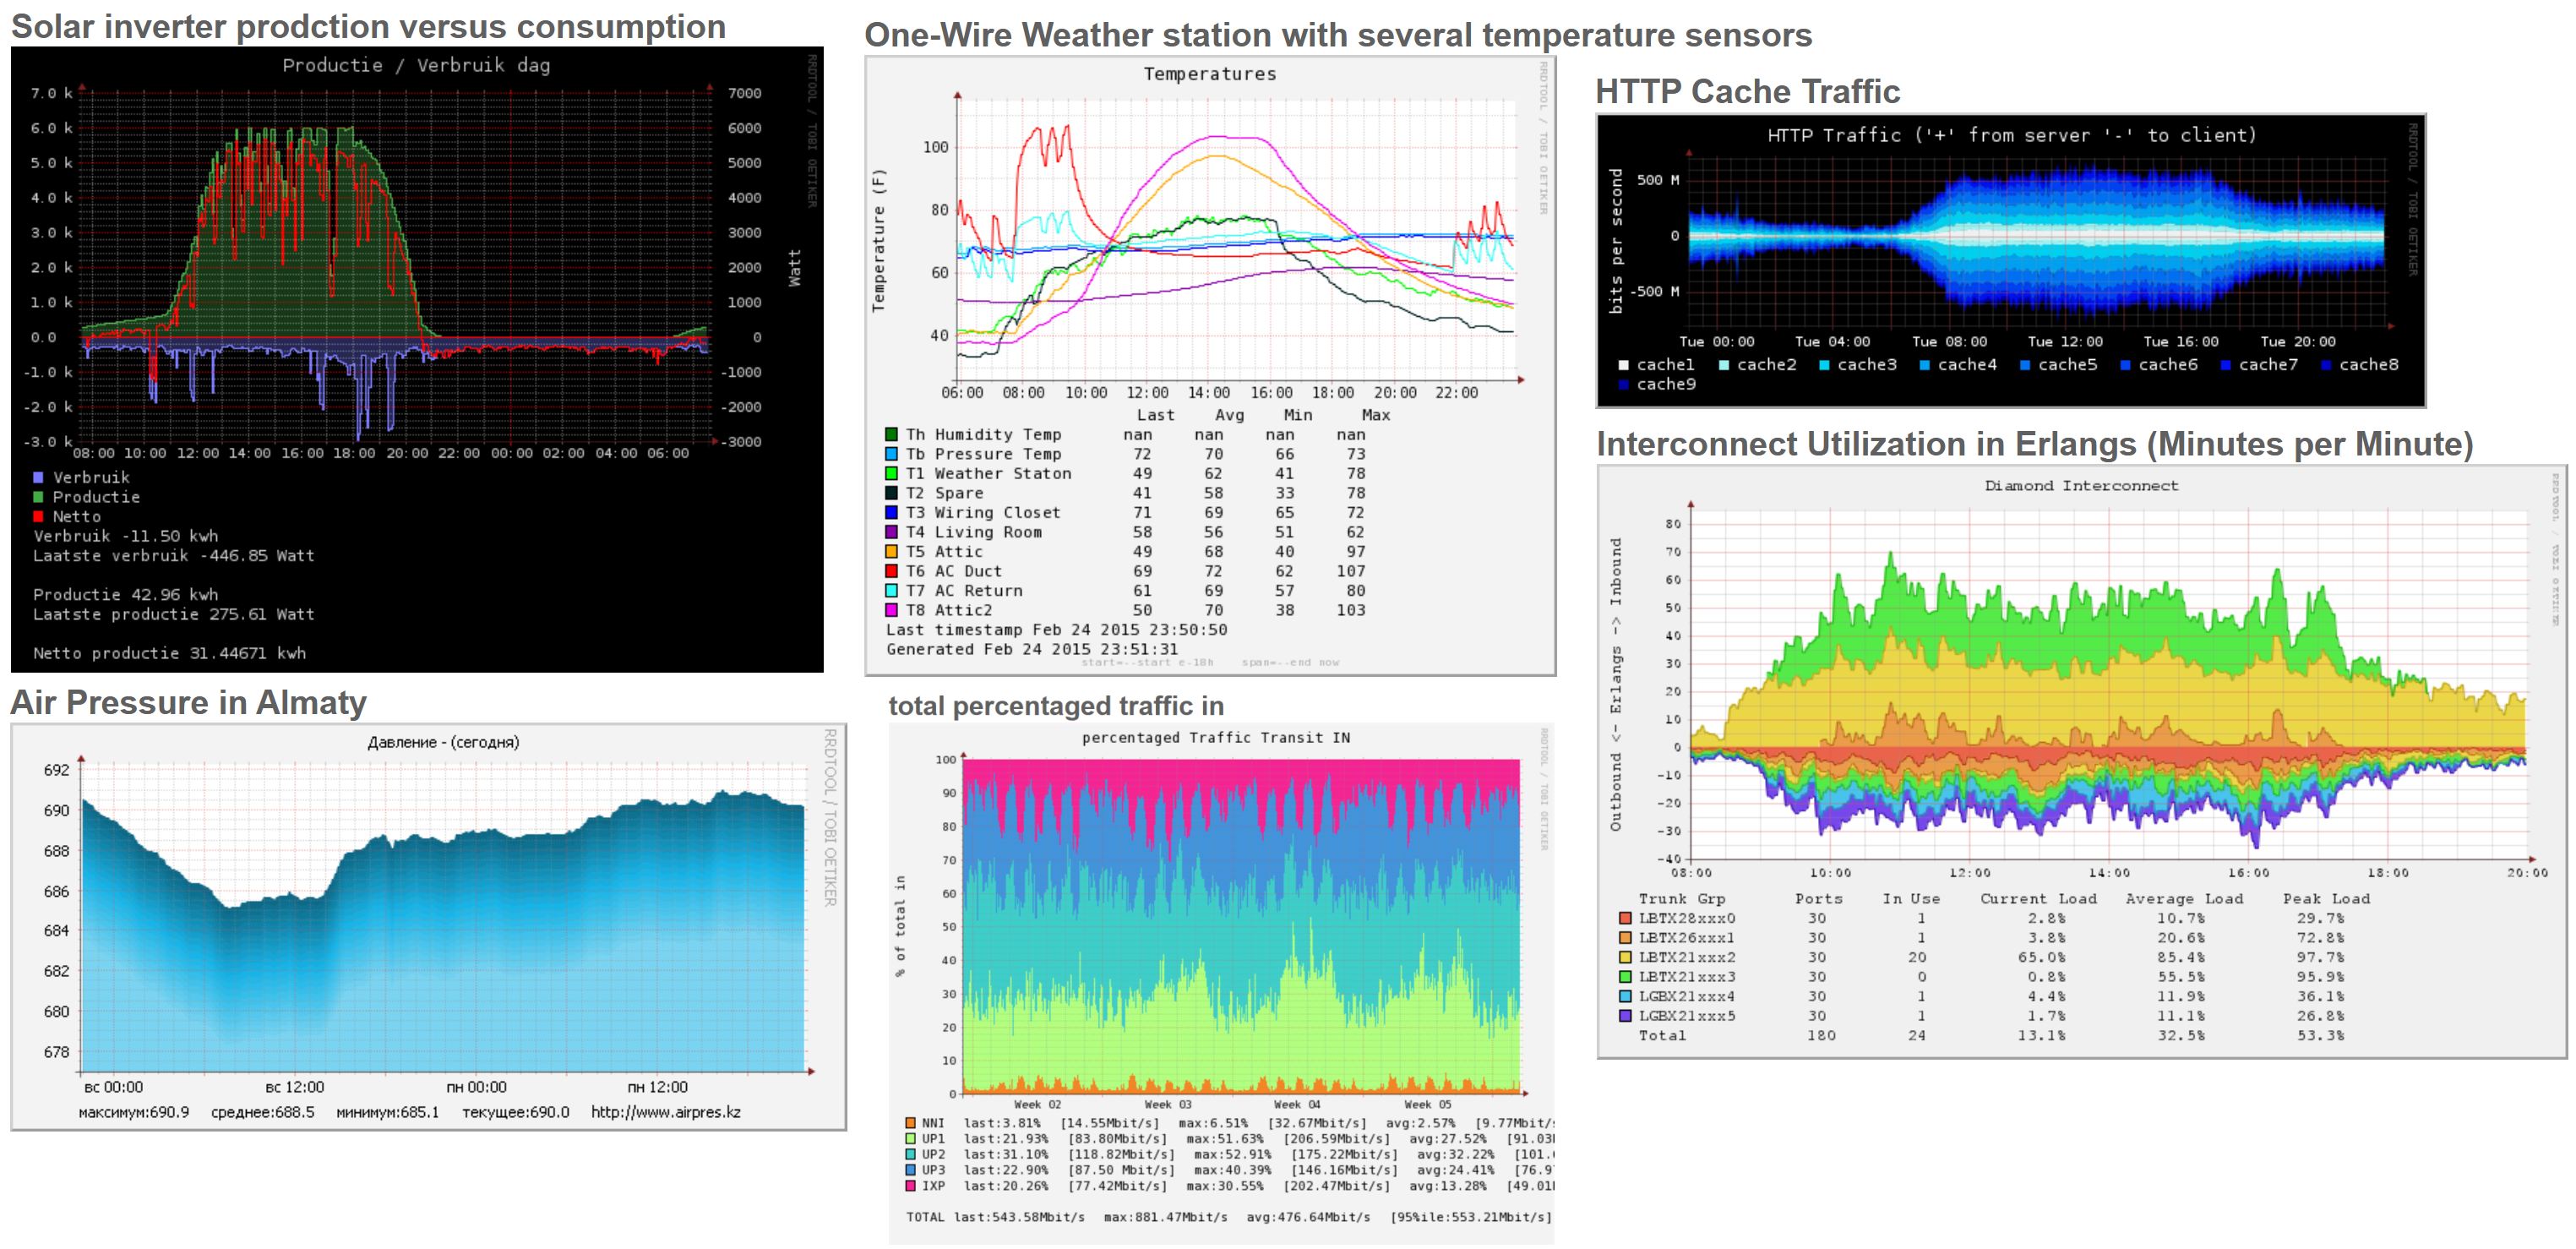
As I forshadowed earlier, rrdtool is very impressive at generating pretty data contained in those rrds. Here are some examples taken from RRDTool gallery:
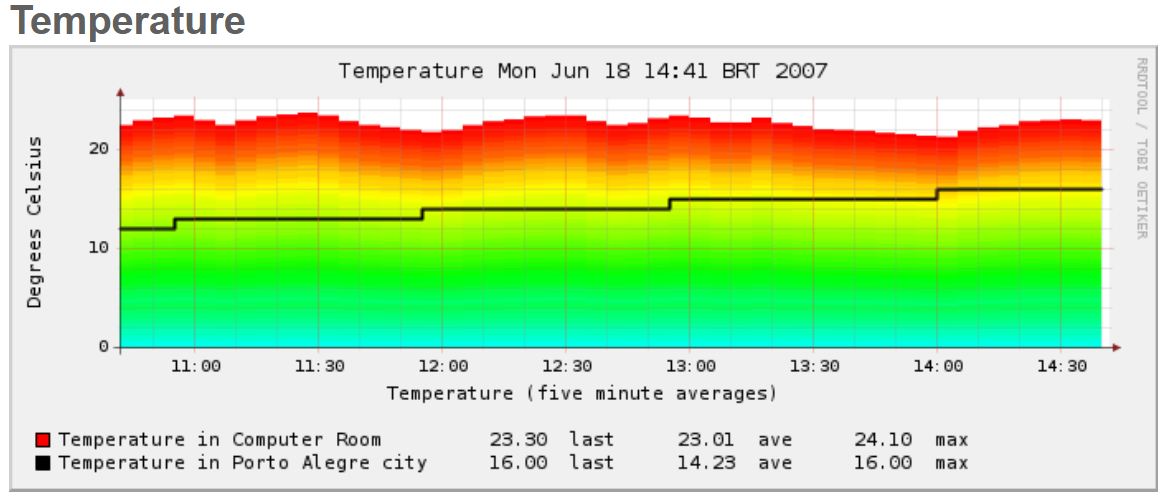
But what i really was looking to do was to generate a rainbow gradient temperature map with for my temperature graph, something like this example from the gallery dated 2007:
And this when we come to the part of the story where the internet is super cool, but trying to recreate things from 2007 in 2025 present certain obstacles because quite honestly things are constantly changing and the references in the RRDTool gallery might still be in the RRDTool gallery but not really still available out on the ever evolving internet. I figured armed with 2025 AI there should be no problem, but the thing is, with 2025 AI if it has not ingested it, it really is not too good at it, and generating rainbow gradient temperature graphics with RRDTool took a super smart person to figure out and for awhile I thought it was a lost art forever.
Until one weekend coffee in bed morning I began using the internet WayBack Machine and hit pay dirt:
- https://web.archive.org/web/20180222115354/http://web-tech.ga-usa.com/2012/05/creating-a-custom-hot-to-cold-temperature-color-gradient-for-use-with-rrdtool/
- https://web.archive.org/web/20170629060130/http://web-tech.ga-usa.com/2012/05/creating-color-gradients-with-rrdtool-bash-using-temperatures/
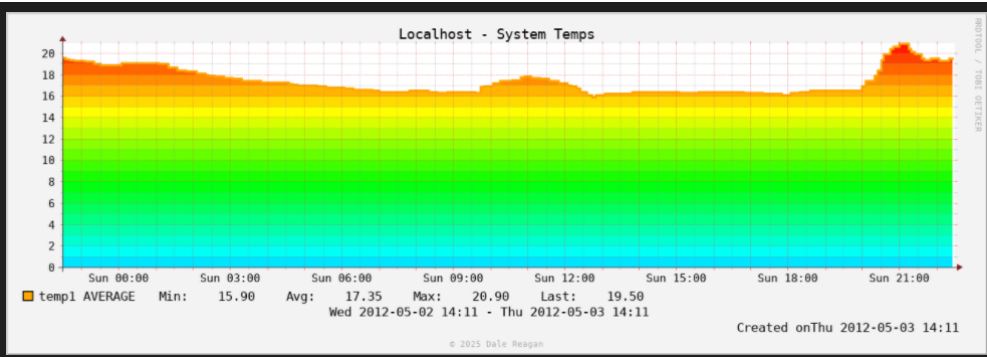
Finally armed with actual examples I was able point it to my rrd temperature data and generate a rainbow gradient temperature graphic (ignore the dates those were hardcoded in the example):
And from there in no time I was generating the gradients you now can see at Refugio Network Weathermap:
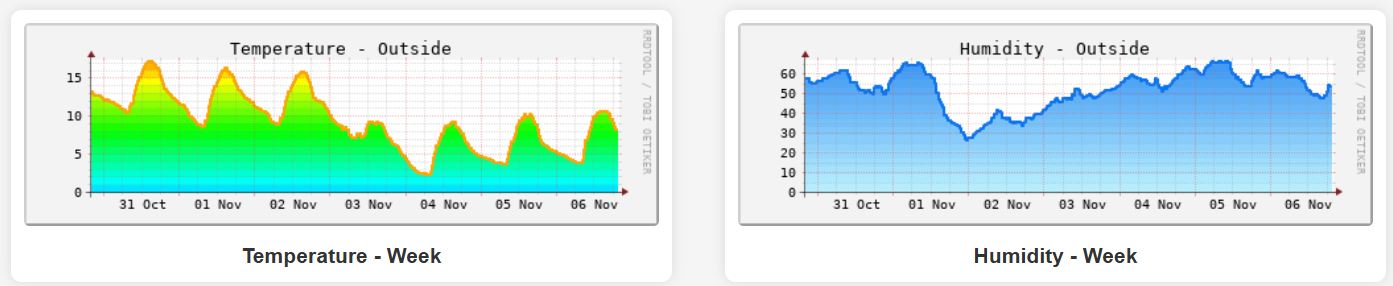
and of course, I will share here the secret sauce:
TB added a later date (funny story: thanks to this post i have realized i have no backups of Raspberry Pi that I have at the refugio)
4. Generating pretty the weathermap
And we finally arrive at the final step of generating the pretty WeatherMaps! When I mentioned “we” setup all sorts of cool Network Weathermaps at the unnamed university, by “we” I really meant Mercedes. For me it was black magic that only Mercedes was able to wrap her head around and understand the confusing manual to generate magic. So when I had to implement it myself this meant reading and rereading the manual multiple times and lots of testing. All of this was further complicated due to the fact the actual version of php it was made for was obsolete years ago. Here I was saved by container technology because I was able to create my own docker container with just the obsolete version of php required that will stay the same with no updates for as long as I am generating my Refujio Weathermaps.
After considerable work I was able to get my first sensor painted on the map:
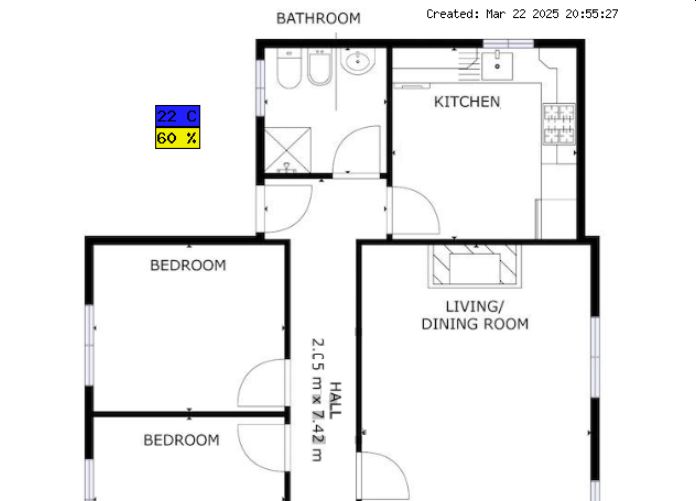
One of the things that was taking my time was finding the right placement for the guages on the map, but IrfanView came to the rescue and it is possible to see the coordinates:
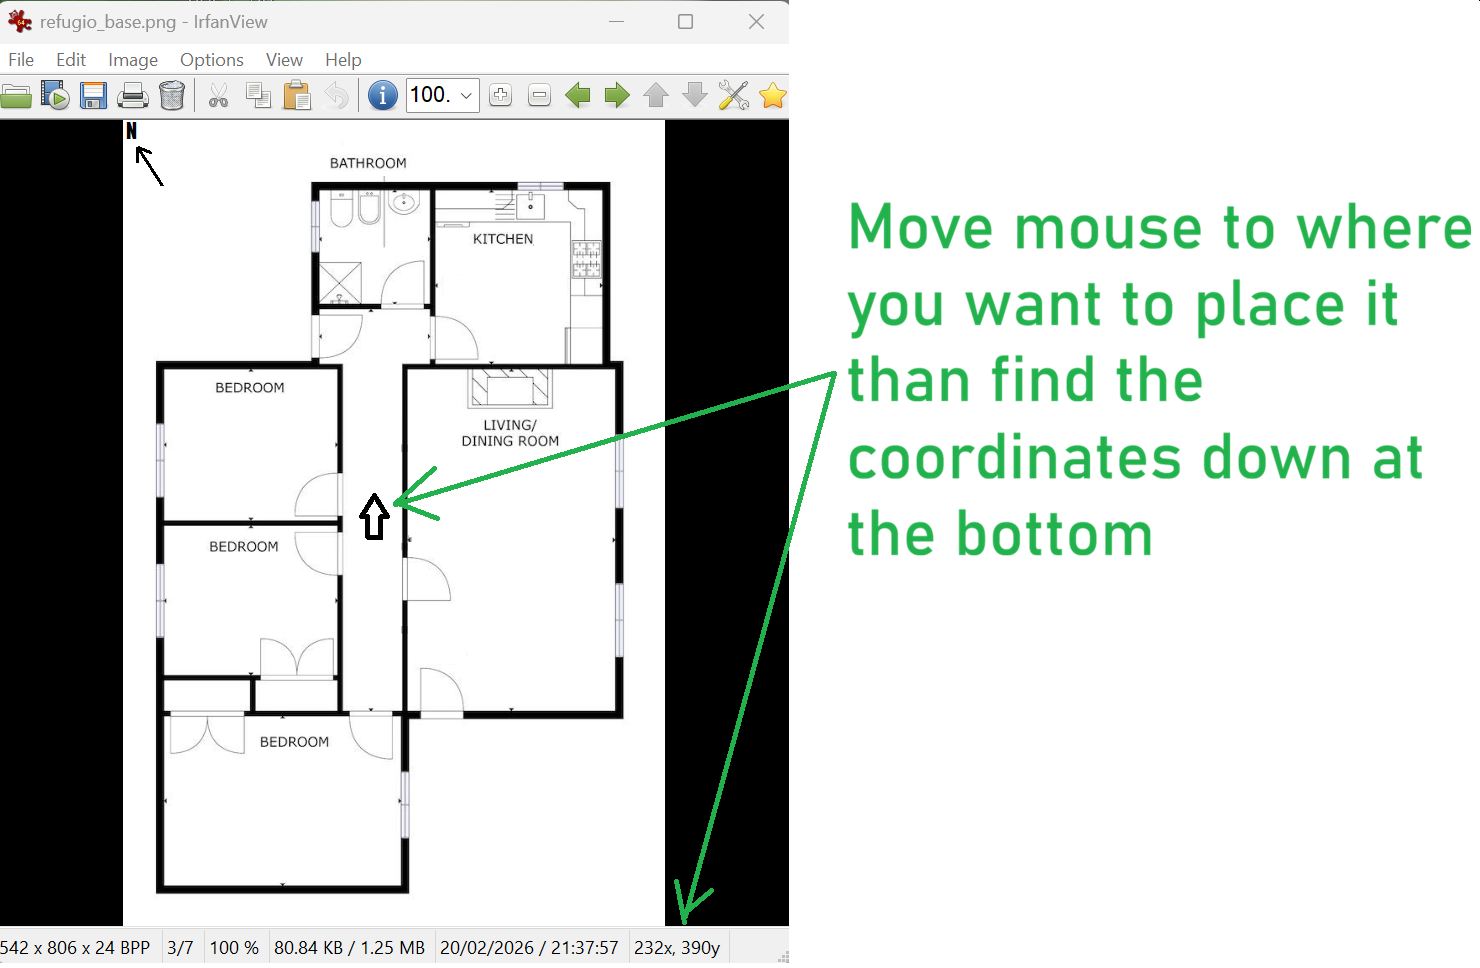
And once you know the coordinates you add “nodes” in the weathermap.conf file for each of the sensors making a reference to where the overlay graphics (INFOURL and OVERLIBGRAPH) are and where to get the current value (TARGET):
NODE Hallway_temp
    POSITION 230 370
    LABEL {node:Hallway_temp:bandwidth_in} C
    USESCALE TEMPERATURE
    LABELFONT 5
    INFOURL http://refugio.jupiterstation.net/Hallway.html
    OVERLIBGRAPH http://refugio.jupiterstation.net/Hallway-temperature-small-day.png
    TARGET /weathermap/room_data.txt
NODE Hallway_humidity
    POSITION 230 390
    LABEL {node:Hallway_humidity:bandwidth_out} %
    USESCALE HUMIDITY
    LABELFONT 5
    INFOURL http://refugio.jupiterstation.net/Hallway.html
    OVERLIBGRAPH http://refugio.jupiterstation.net/Hallway-humidity-small-day.png
    TARGET /weathermap/room_data.txt
and you then setup crontabs to run every 5 minutes and you have your Refugio Network WeatherMap!
Links, References and things that helped with this
Thanks for reading and feel free to give feedback or comments via email (andrew@jupiterstation.net).