Grafana monitoring and more importantly alerting!
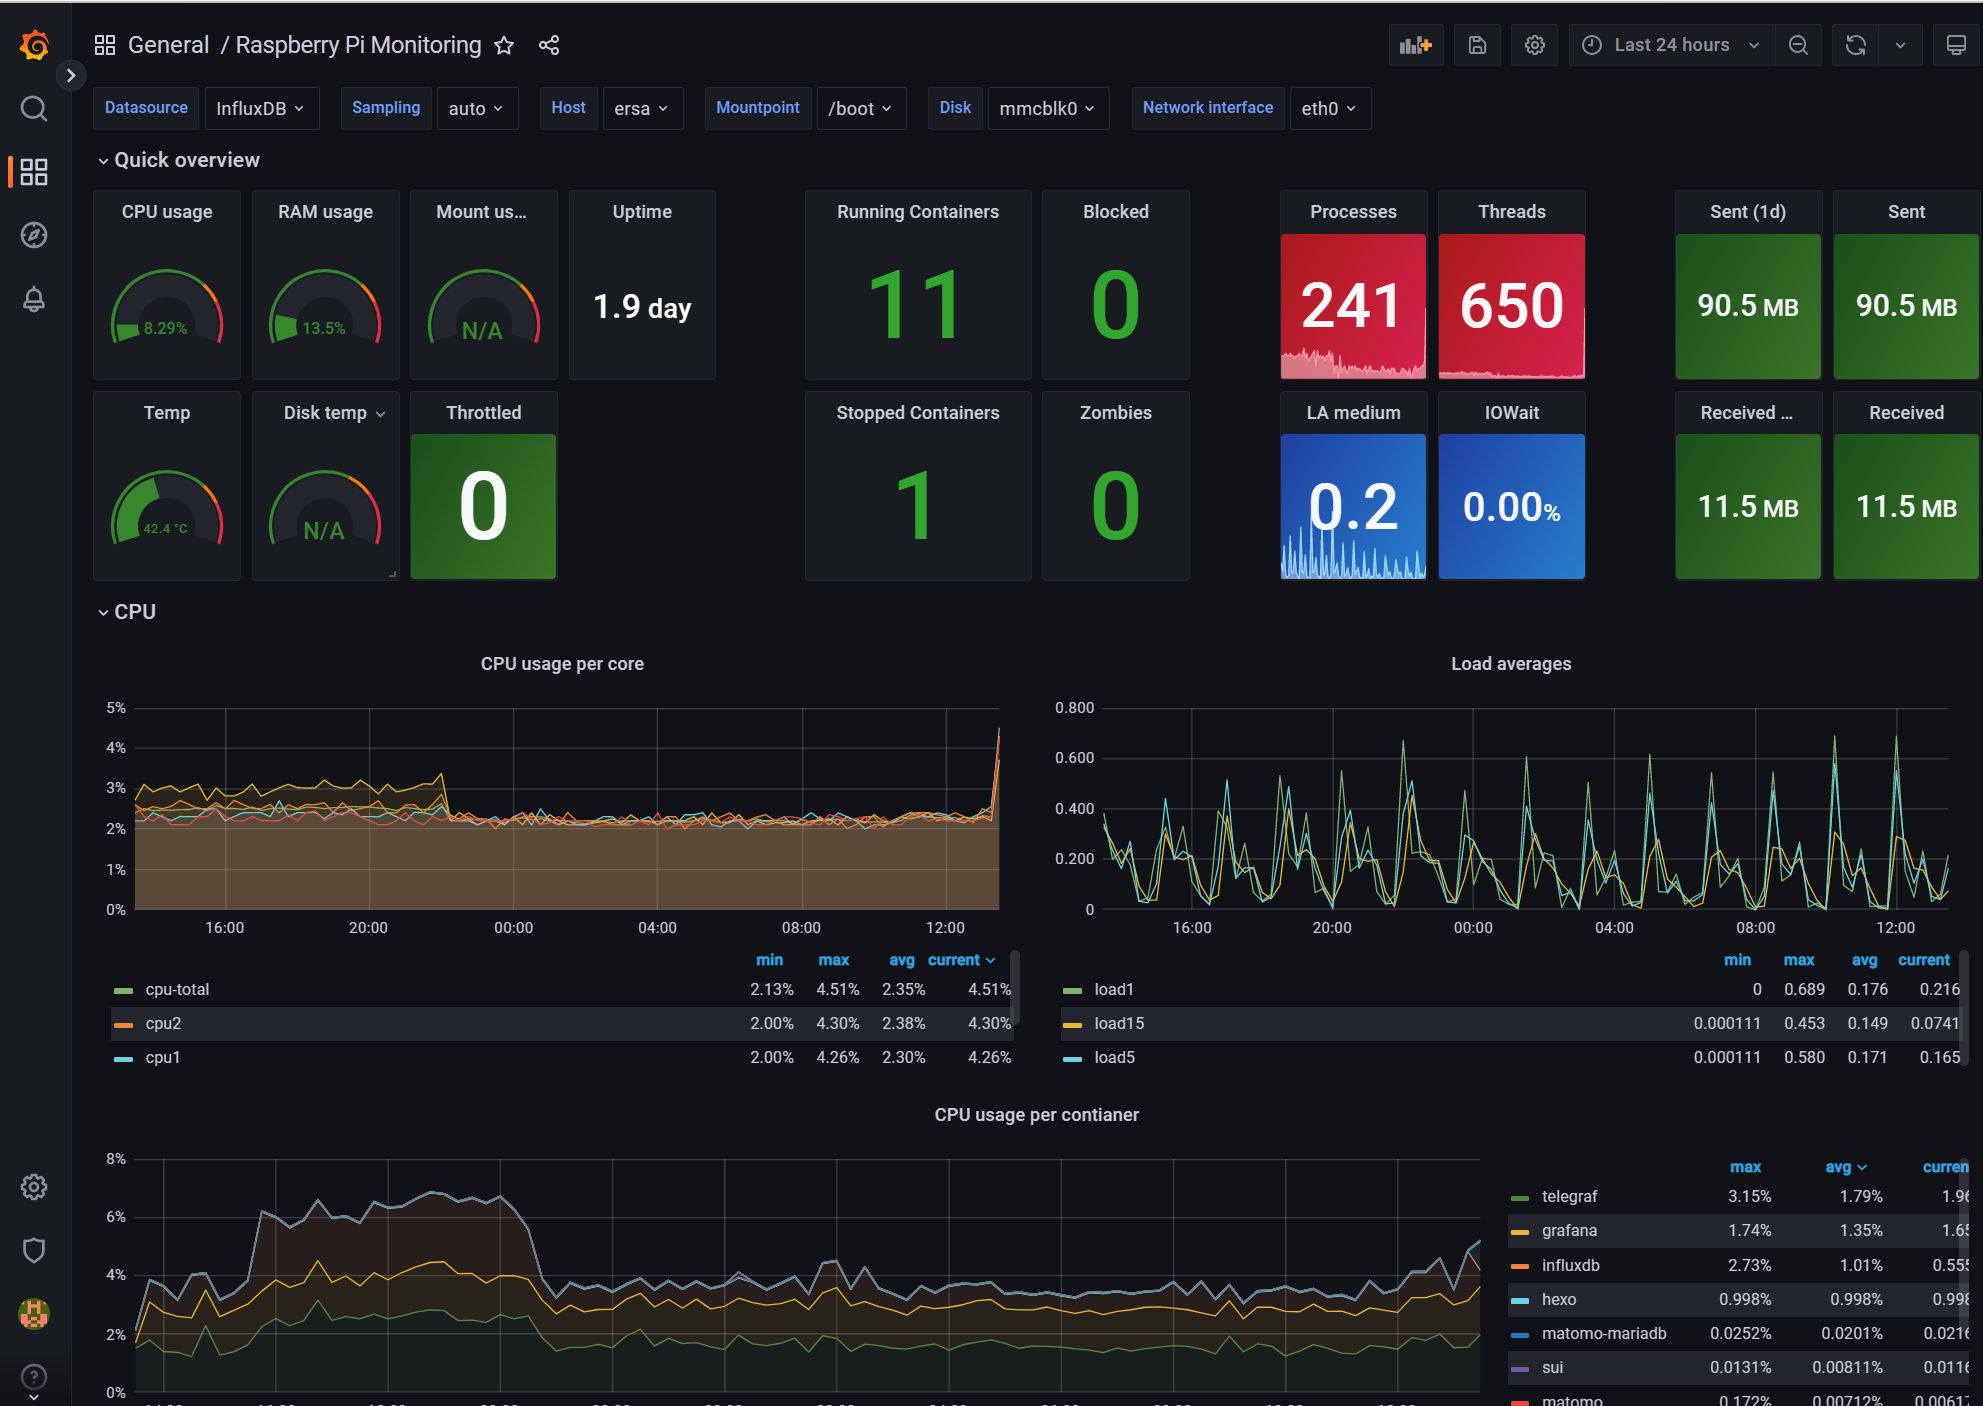
So the first docker containers I fired up on my new Raspbery Pi 4 with 8 GB of RAM when I received it back in July of 2022 were Telegraf, Influx, and Grafana to monitor the new little doggy. And I got a really pretty dashboard working and then kinda forgot about it:
Until this week when I realized that I had a process pegged at 100% since way back in december:
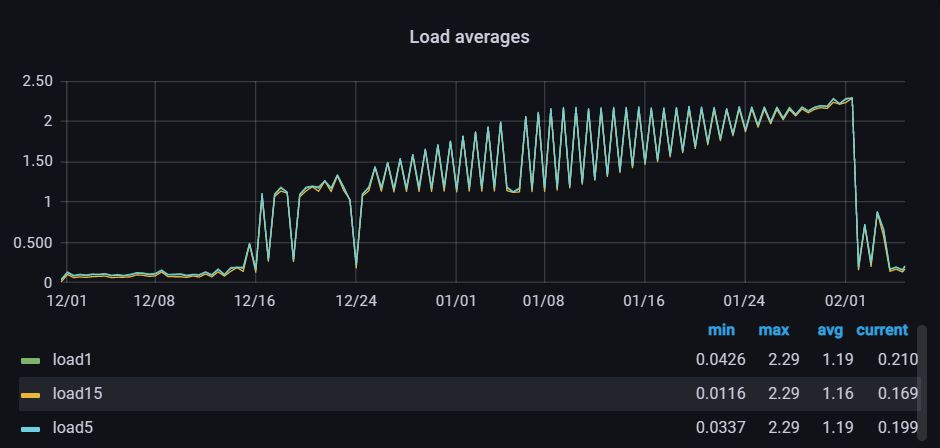
So the first thing to do was to figure out what was pegging the CPU which turned out to be a nightly log rotation that went bad. Unfortunately can’t put too many details because I did not take any notes while investigating and solving, only can comment that it had created thousands of files and every time it tried to run hung. Trying to clean up the files was really fun as doing an rm with a wildcard even gave me and error that there were too many files. Google to the rescue and I got that under control but realized that having a really pretty dashboard did nothing if I did not setup up alerting when things were abnormal.
Setting up Grafana Alerts
So I have to say that while Grafana is really cool, really pretty, and seems really easy, for me it tends to be really complicated. It always makes me feel rather slow and I tend to just hack and hack until I get what I want. In this case was no different. I tried to RTFM, but the manual made it look much easier as in their example it was possible to browse the measurements but in my case it just gave me an empty box:

So I had to go to my dashboard copy the query from the chart I wanted and keep hacking at it until i got it to work.
So this is what i finally settled on for CPU monitoring:
from(bucket: v.bucket)
|> range(start: v.timeRangeStart, stop: v.timeRangeStop)
|> filter(fn: (r) => r["_measurement"] == "cpu" and r["_field"] == "usage_idle" and (r["cpu"] =~ /cpu[0-9]/ or r["cpu"] == "cpu-total"))
|> map(fn: (r) => ({ r with _value: r._value * -1.0 + 100.0 }))
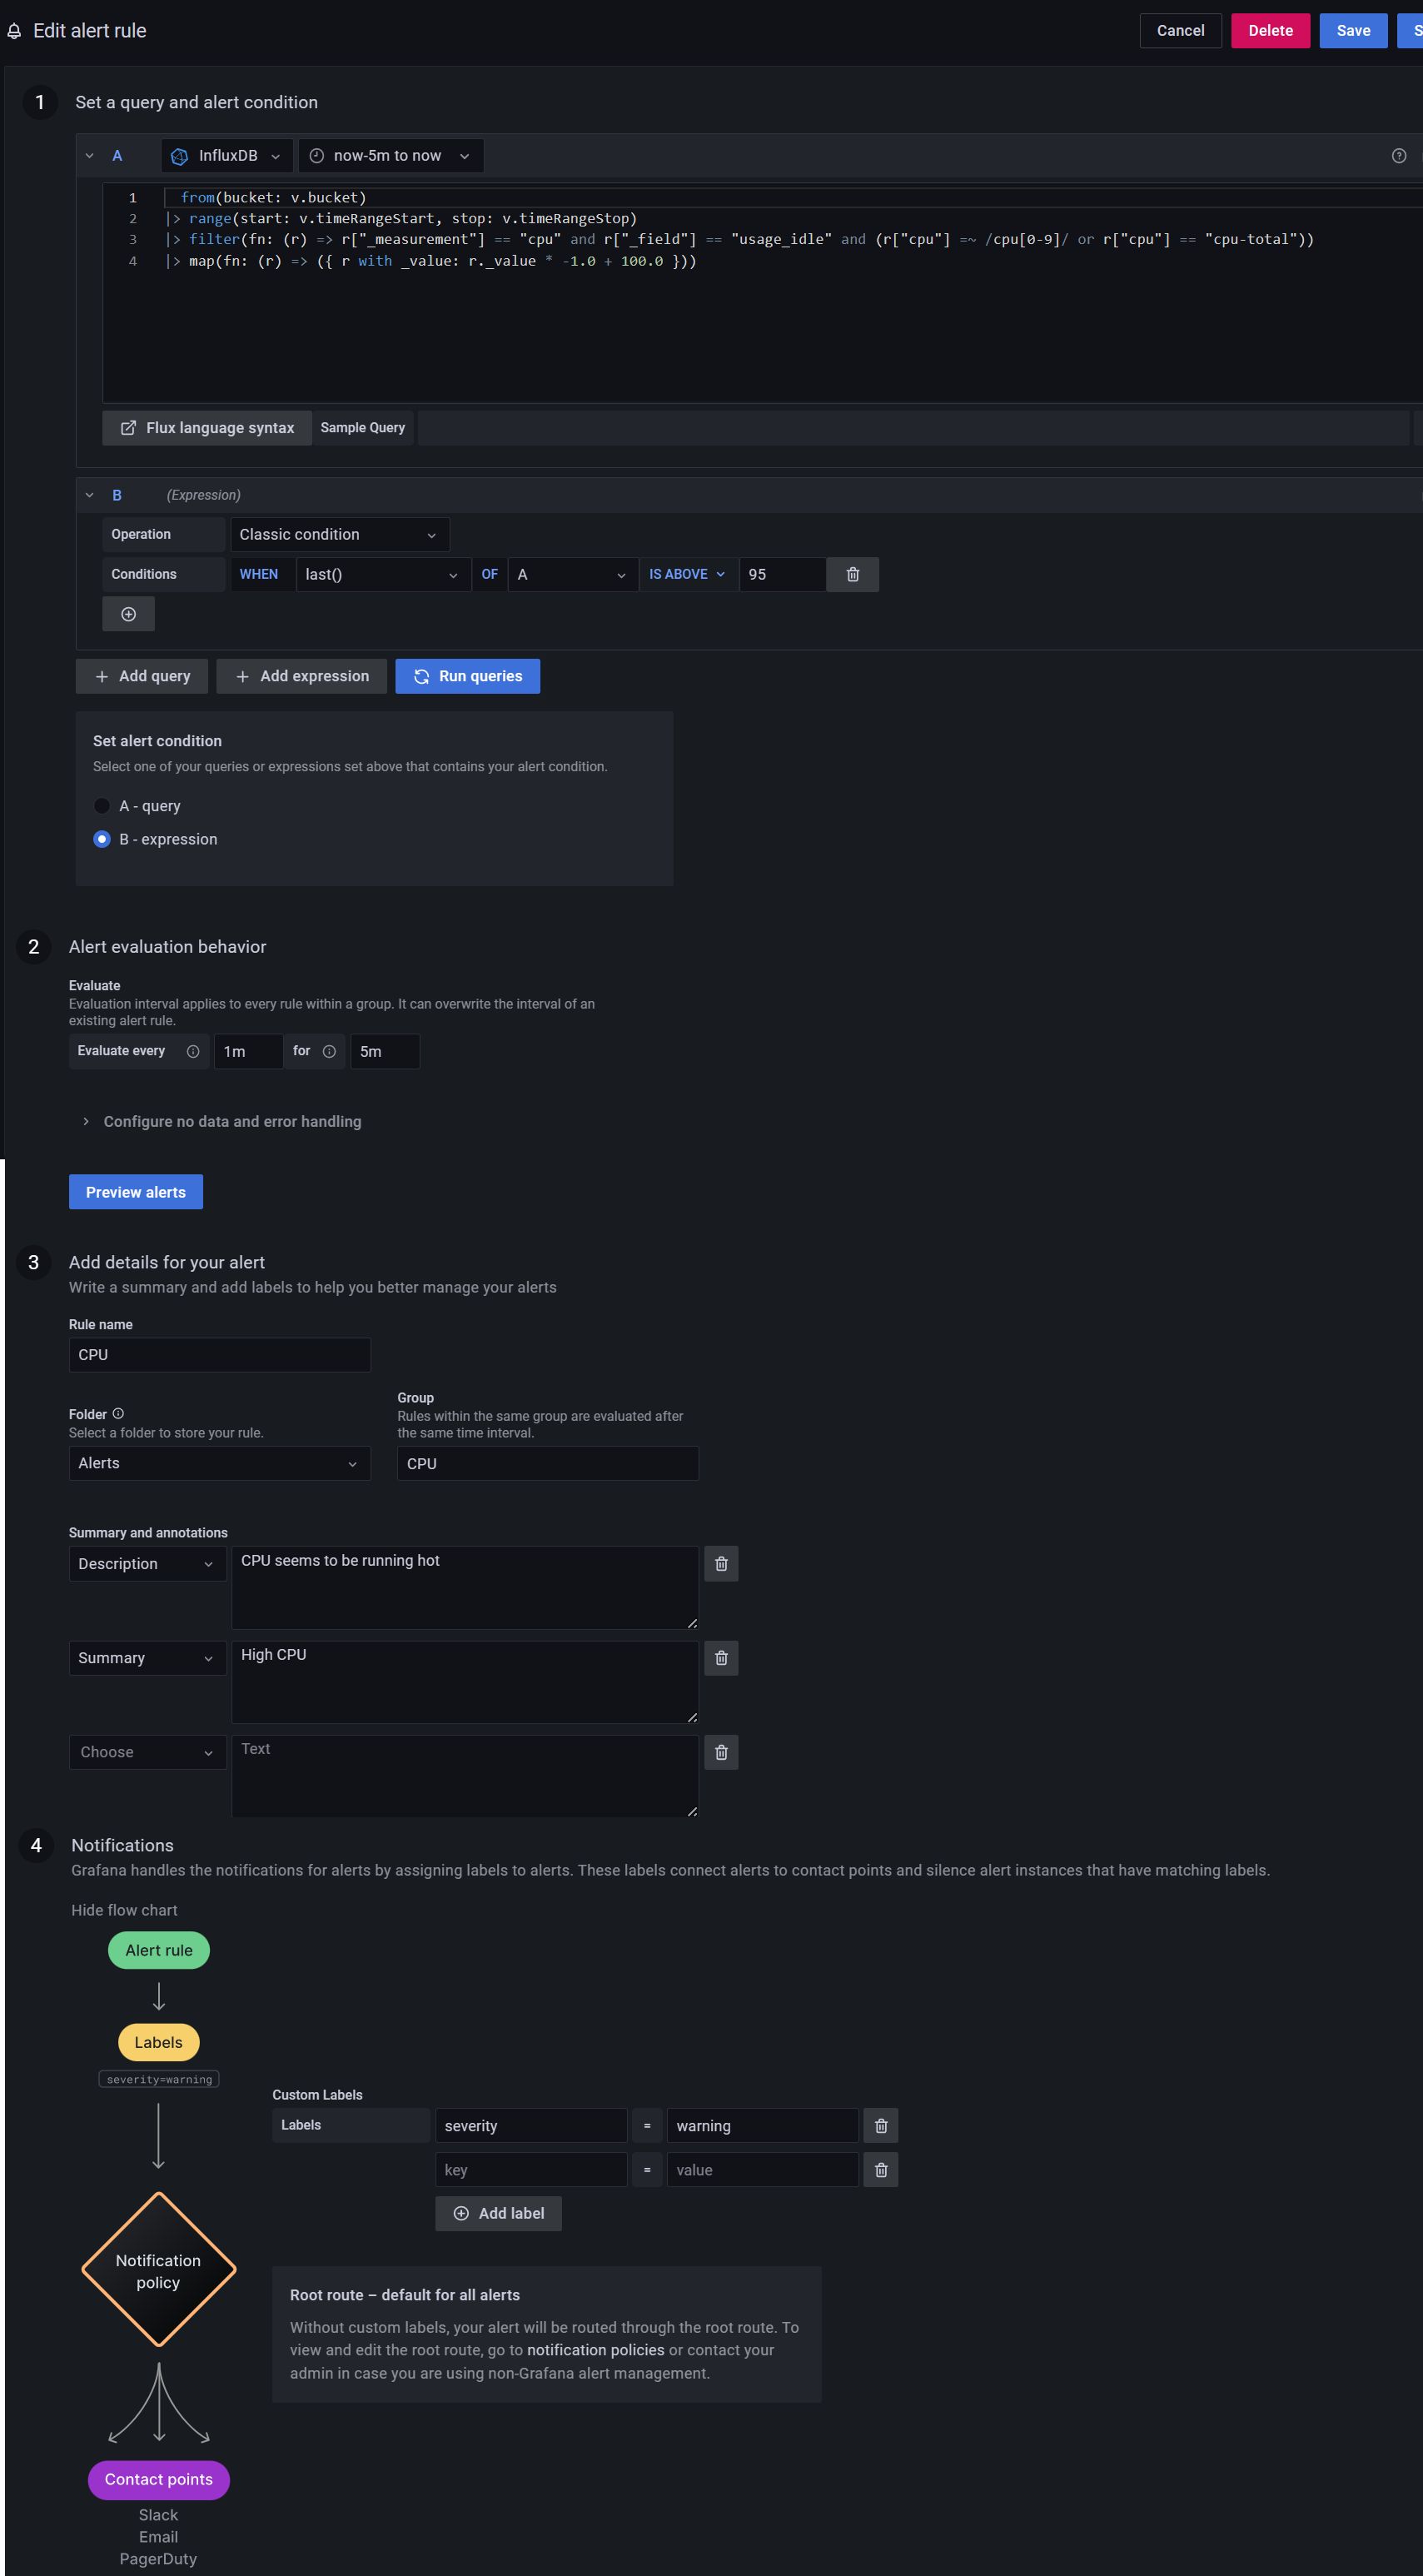
I then had to fight quite a bit with the SMTP setup, which for some reason there is no way from the web interface to setup, but it is controlled in the grafana.ini file which I had not exposed on a persistent volume so I had to change the docker config mapping it to a file. Once I was able to successfully send myself a test message i finished setting up the alert (please note I have no idea what I am doing and as previously mentioned I feel I am all thumbs with Grafana so if this alert is really ass backward, please be kind):
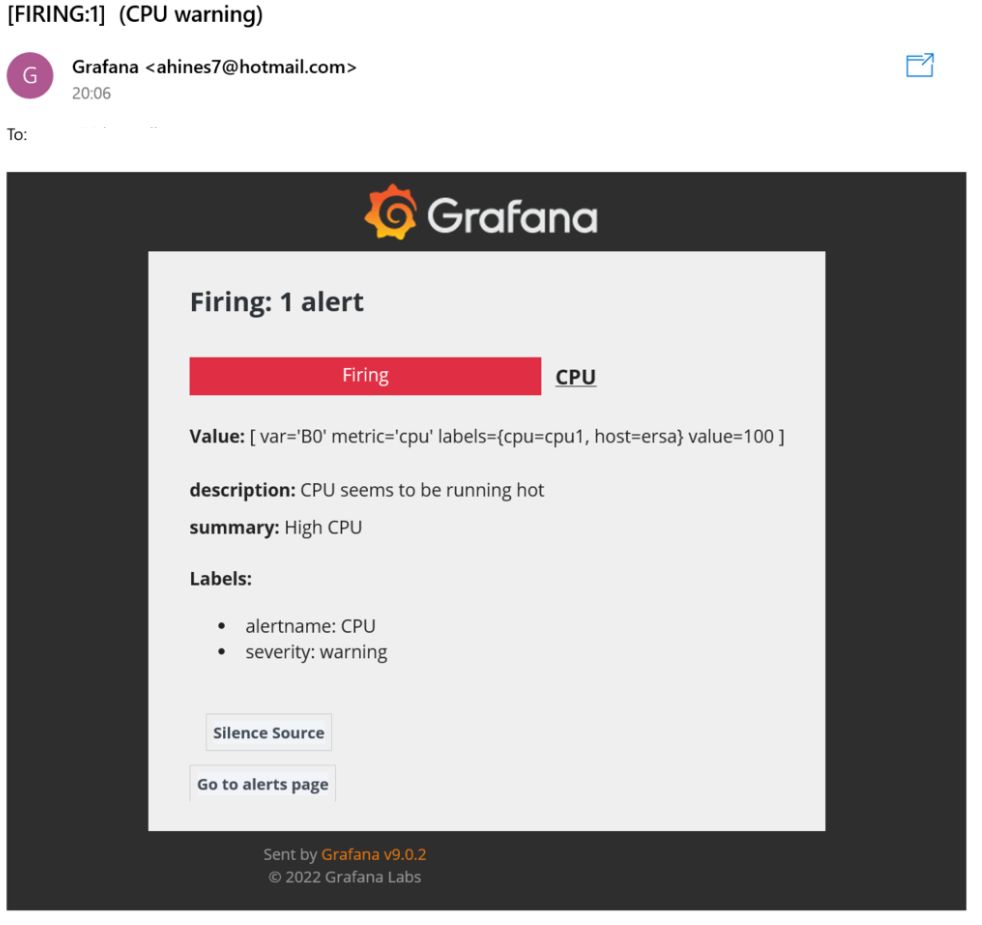
So next thing to do is provoke a bit of a CPU spike and wait, hope, and pray I get an alert:
cat /dev/zero > /dev/null
caused one of my CPU’s to peg at 100% nicely:
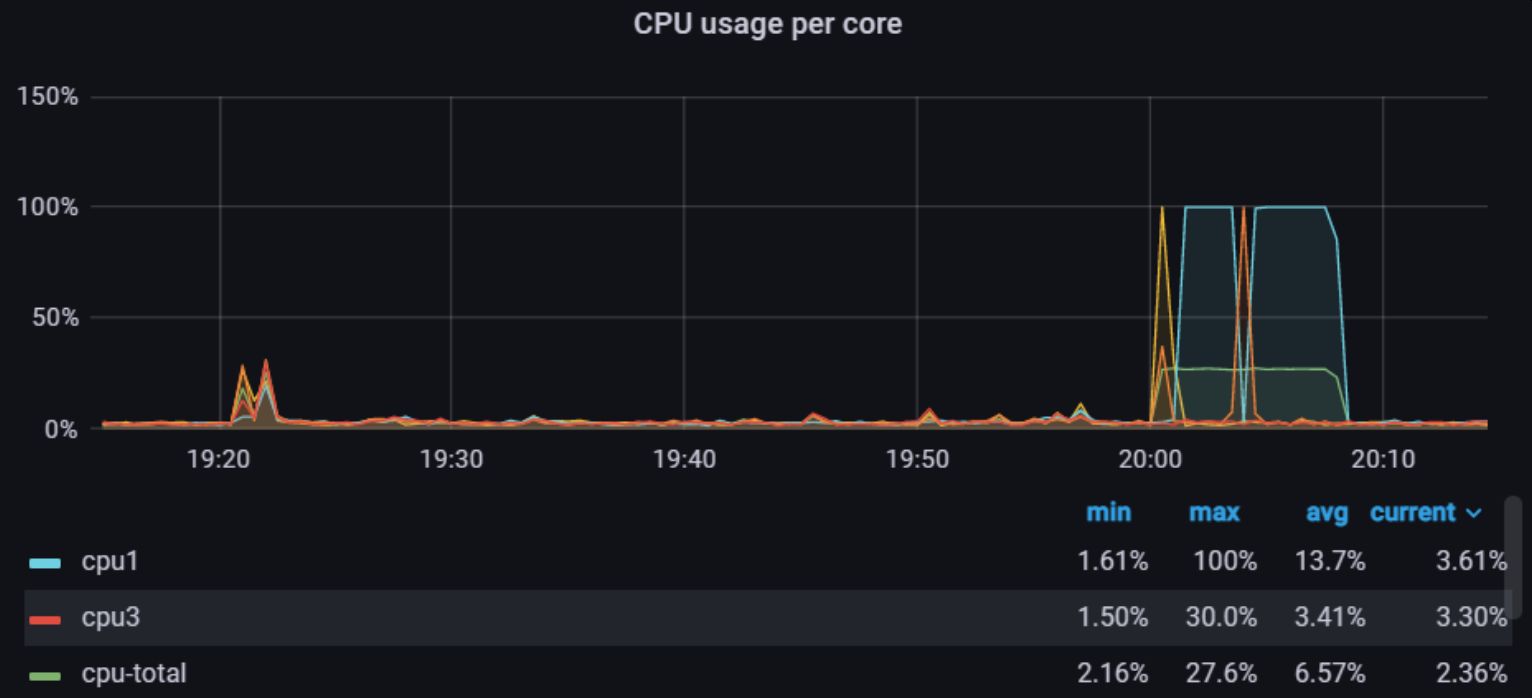
and all the hoping and preying paid off!!!
I then proceeded to setup memory monitor and when I get a change will setup a disk and network montitor.
I realize i will have to revisit this and improve the montitors if I ever begin monitoring my other Raspberry Pies that are spread across the globe, but for now this is a good MVP to let me know when something is amiss with my local Pi.
Thanks for reading and feel free to give feedback or comments via email (andrew@jupiterstation.net).